
This summer I worked with The Ceph Foundation under Google Summer Of Code ‘21 (GSoC) programme.
Google Summer of Code is a global program focused on bringing more student developers into open source software development. Students work with an open source organization on a 10 week programming project during their break from school.
In this blog, I’ll share my journey of completing the project “Visual Regression Testing of Ceph Dashboard”.
Experience
My GSoC experience has been amazing, from the initial days of having zero clue of how to navigate around the codebase to successfully completing my project. Along the way I learnt:
- Test Driven Developement (TDD).
- How to work on problems together.
- Reviewing other’s code.
- Efficient communication.
- PR etiquettes.
- Working in scrum environment.
Also I can’t thank my mentors Ernesto Puerta and Alfonso Martinez and the whole Ceph dashboard team enough for their constant support, reviews, feedback and what not. Things I’ve learnt during my period have not only made me an overall better programmer, but also the real world experience I gained, has been priceless.
Project
The project that I worked on was “Visual Regression Testing of Ceph Dashboard”, so Visual Regression Testing checks what the user will see after any code changes have been executed by comparing screenshots taken before and after code changes. This project immediately caught my eye when I first saw it on GSoC’s project list, I had never heard of visual testing then and it just seemed like a very interesting idea. I dived deep into the project and it just kept getting better, there were all these amusing topics like pixel by pixel bitmap matching, anti-aliasing, browser offsets, etc. that I never lost interest from. In this blog post, I’ll guide you through my project and the challenges I faced in my journey.
Visual Regression Testing
So to understand what visual regression testing is, we need to first understand what regression testing is. Regression Testing is used to verify that any system changes do not interfere with existing features and/or code structure. There’s a reason regression tests are part of almost every test suite in software development. It is common for devs to change or add a section of code, and having it unintentionally disrupt something that was previously working just fine. Visual Regression Testing applies the same logic but confines testing to the visual aspects of the software. In other words, it checks that code changes do not break any aspect of the software’s visual interface. A visual regression test checks what the user will see after any code changes have been executed by comparing screenshots taken before and after code changes. This is why visual regression tests are also sometimes called visual snapshot tests.
Why Visual Regression Testing
In ceph dashboard, we already have the whole testing pyramid set-up and running, so the question is why do we need visual testing?
- Visual bugs are rendering issues. And rendering validation is not what functional testing tools are designed to catch. Functional testing measures functional behavior.
- It helps in picking up css bugs, where sometimes user is not able to see critical buttons, or they are in an unclickable position.
- The other very useful feature of this testing was that it helps make informed decisions when having breaking changes, like:
- Undergoing large refactorings.
- Upgrading frameworks or libraries which can impact many components.
What are Visual Bugs
Visual bugs are problems associated with the user interface (also known as GUI) of a web or mobile application. Although these bugs do not have any functional impact, they can ruin that particular website or app’s user experience.
A few examples of Visual bugs would be:
- Misaligned texts or buttons
- Overlapping images or texts
- Partially visible elements
- Responsive layout issues. For example, a button rendering on the desktop browser may not render on a mobile browser
In some cases, the visual bugs obstruct end-users from accessing the key functionalities of an application. In such a case, that bug needs to be reported as a functional bug.
As mentioned earlier, any visual bug can ruin the user experience of an application. Consequently, this can negatively impact the way end-users perceive a particular brand online.
Some examples of visual bugs around the internet:
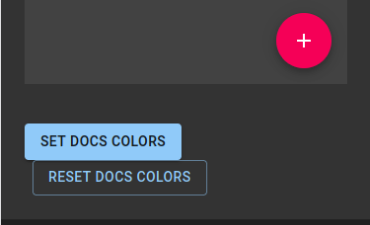
Material-UI's website with misaligned buttons
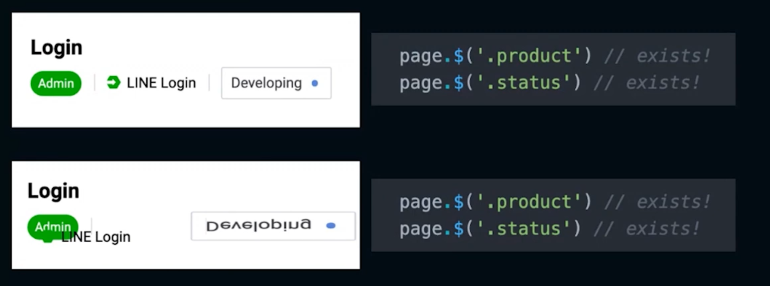
And in this image, a visual bug obstructs user from accessing key functionality of an application. These types of visual bugs easily pass through undetected from End to end tests, because they mostly check for existence of elements
Algorithm
The general algorithm for visual regression tests looks like this:
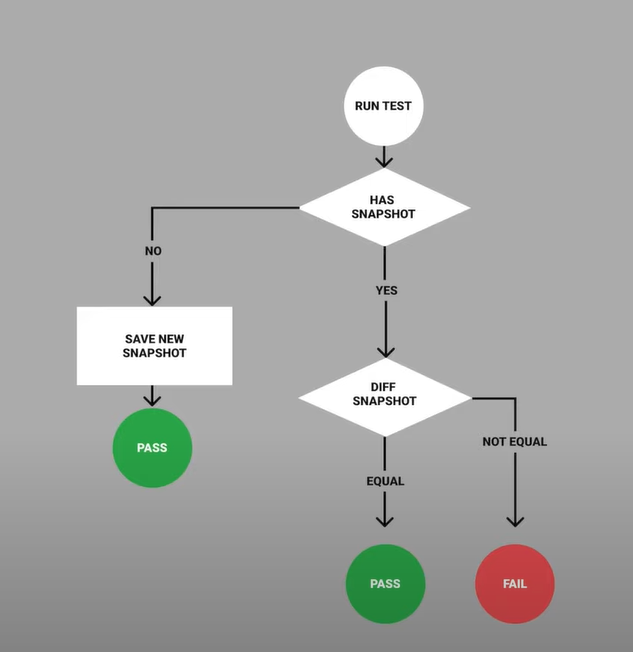
Visual regression tests flowchart
Choosing The Right Tool
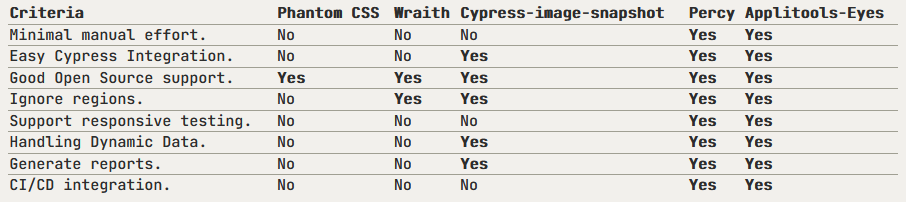
One of the main task for my project was choosing the best tool for visual regression testing. For this, I came up with a criteria to judge various tools, it was:
- Minimal manual effort.
- Easy Cypress Integration.
- Good Open Source support.
- Ignore browser, platform and anti-aliasing offsets.
- Support responsive testing.
- Handling Dynamic Data.
- Generate reports with comparisons.
- CI/CD integration.
Benchmarking
The next step in my process was comparing tools, matching them with the criteria and benchmarking them.
Bitmap Comparison
The problem with the first three tools was that they used pixel by pixel bitmap matching. In bitmap comparison, a bitmap of a screen is captured at various points of a test run and its pixels are compared to a baseline bitmap. In comparison stage they iterate through each pixel pair, then check if the color hex code is the same. If the color codes are different, it raises a visual bug. While these are very fast, they are prone to a lot of false positives.
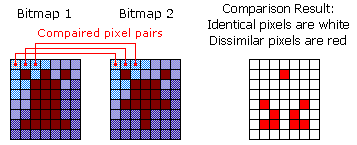
How bitmap comparison works
Bitmap comparison is generally prone to two types of false positives:
-
Dynamic Data:
When you have dynamic content that changes — where you want to check to ensure that everything is laid out with proper alignments and no overlaps. Pixel comparison tools fail here.
False positive due to Dynamic data in Ceph Dashboard
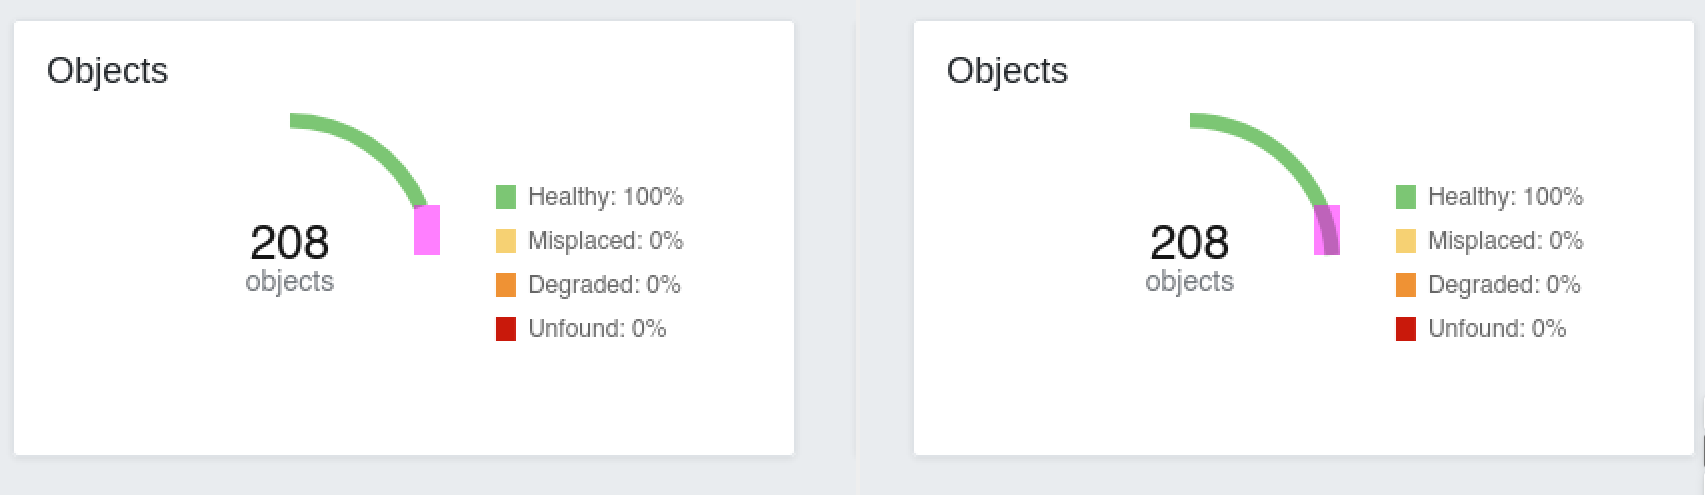
- Anti-aliasing & Browser Offsets:
Font smoothing algorithms, image resizing, graphics cards, and even rendering algorithms generate pixel differences. And that’s just static content. The actual content can vary between any two interfaces. As a result, a tool that expects exact pixel matches between two images can be filled with pixel differences.
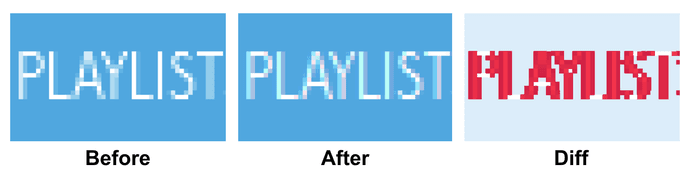
False positive due to browser specific rendering
Solution
And to our rescue we have AI for visual regression testing. And unlike pixel by pixel comparison, AI-powered automated visual testing tools do not need special environments that remain static to ensure accuracy, and hence have a high degree of accuracy even with dynamic content because the comparisons are based on relationships and not simply pixels.
The two AI powered visual regression testing tools that I benchmarked were:
- Percy
- Applitools-Eyes
Both the tools are really good and check all the right boxes, because of which deciding between the two wasn’t easy. Applitools-Eyes came off to me as more feature rich, like having different match levels, etc. and Percy definetly had better UI and amazing documentation. In the end I chose Applitools-Eyes for the ceph dashboard, as it had some features like RCA (root cause analysis), that was just too good for me to give up.
Currently for ceph dashboard, we’re on Applitools’s open source plan, which allows up to 10,000 checkpoint screenshots. For more details on the open source plan, visit here.
What Visual Testing Is Not
So on a closing note, let’s talk about what visual testing is NOT:
- Does not verify logic or functionality
- Can’t replace Functional Tests
- Not a typical fully automated test suite.
Links
To Conclude
It has been an amazing summer getting to work on such an important project with guidance from my always-helpful mentors Ernesto, Alfonso and the dashboard team. I was able to present and demo the project in Ceph Developer Monthly (CDM) on 31st August. It was a summer filled with learning, and I am very excited to continue contributing to Ceph post-GSoC.
You can always reach out to me on my email me at: aaryanporwal2233@gmail.com.
Thanks for reading 👋 !